POS sales reports: the five a shop owner should actually read
Every billing system produces dozens of reports. Most shop owners open two of them, usually the daily total and whatever the accountant asks for. The rest sit unread. That is a waste. A handful of POS sales reports answer most of the questions that decide whether a shop makes money, and the billing system is already collecting the data.
The trick is picking the right five and reading them on a fixed rhythm, not when something feels wrong.
On this page
Report one: the day close
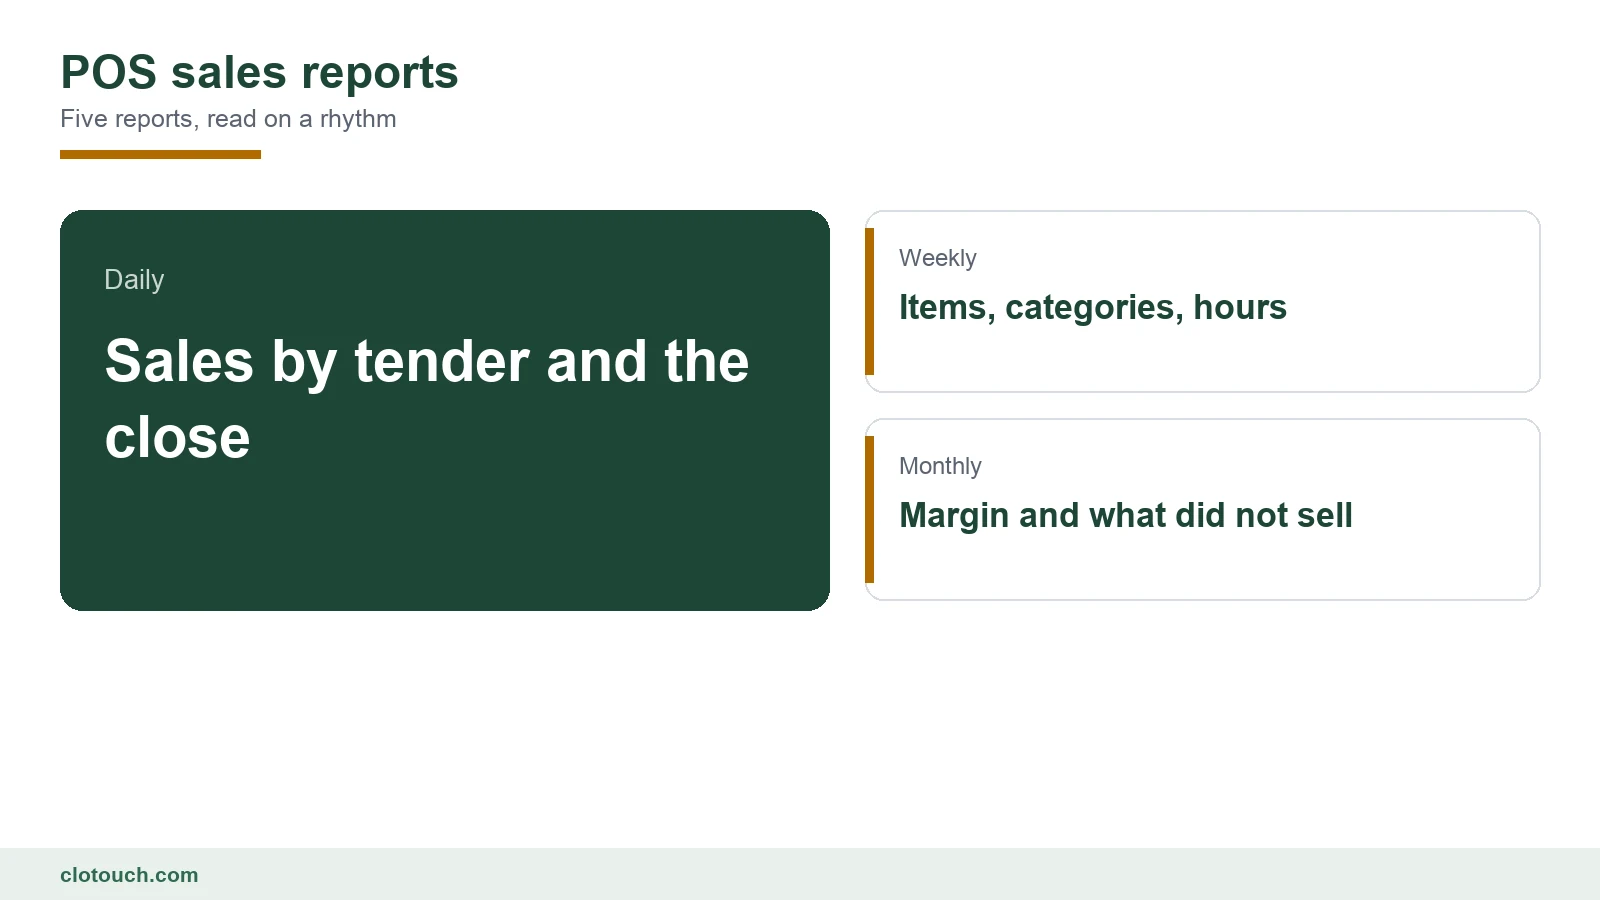
The day close is the only report that checks the others. It splits sales by tender, compares cash expected with cash counted, and lists discounts and voids.
Read it every day, even when it balances. A run of perfect days followed by one gap is easy to explain. A month of unread reports followed by a big gap is not.
Report two: sales by hour
Sales by hour tells you when the shop is actually busy, which is often not when the owner thinks it is. It drives staffing, opening hours and when to restock the shelves.
Look at it weekly, by day of the week. Saturday afternoon and Tuesday afternoon are different shops, and staffing them the same way wastes money on one and loses sales on the other. The report also shows the dead hour most shops have, which is the right time for restocking and counting.
Report three: items and categories
This is the report owners think they know without reading. They usually know the top five items. They rarely know the next fifty, and that is where the surprises live.
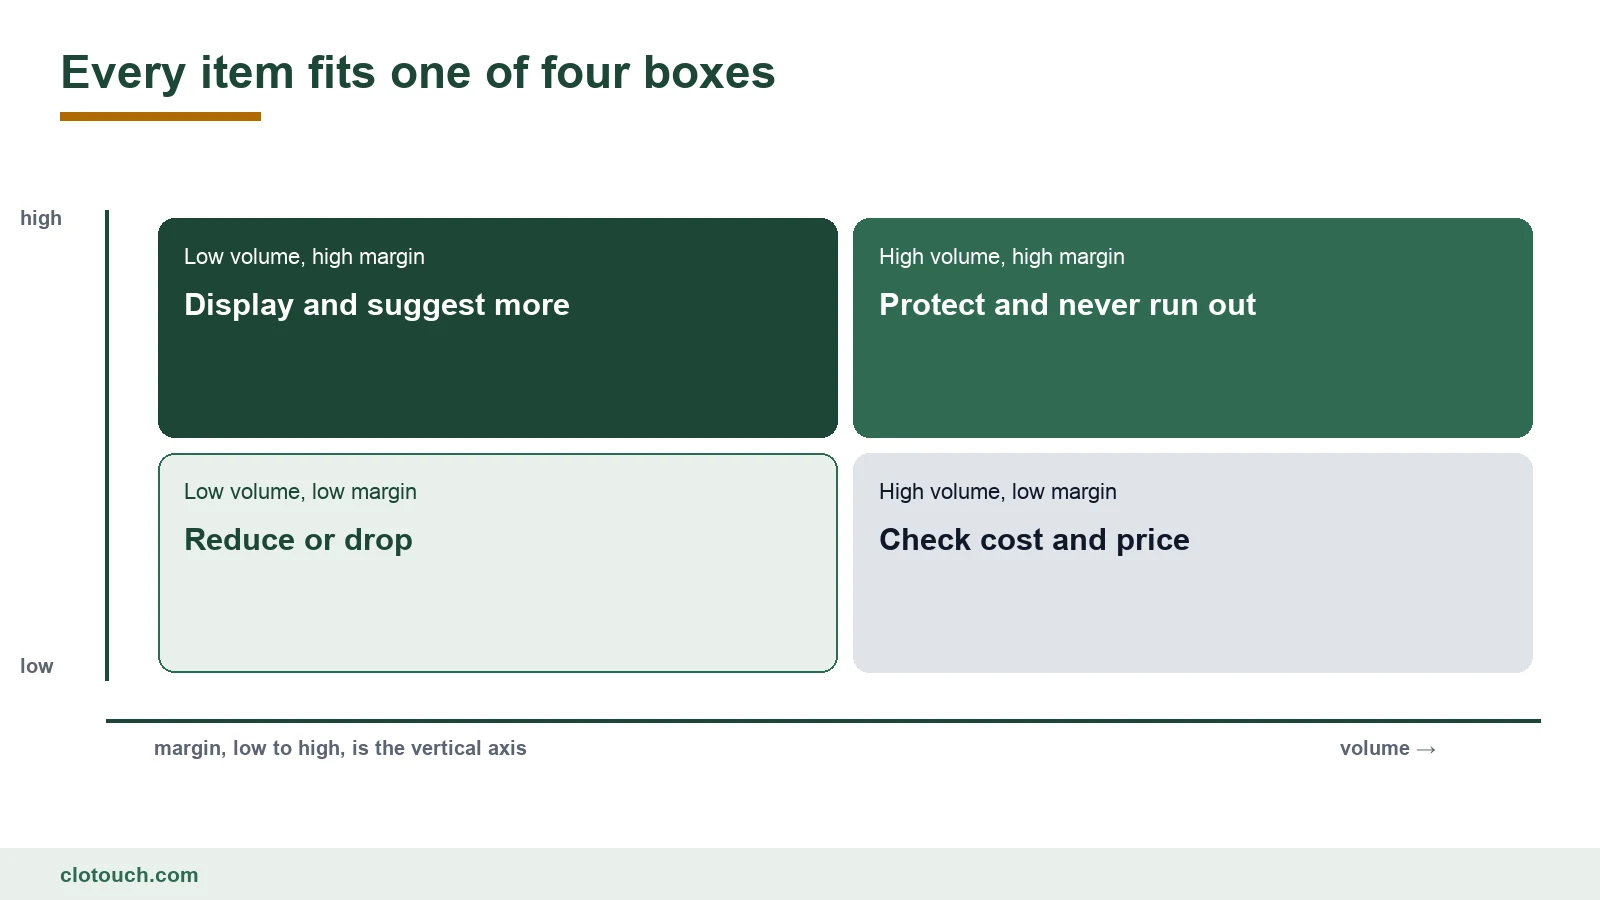
Sort items by volume and by margin together. An item can sell constantly and earn almost nothing. Another can sell rarely and carry the shop’s best margin.
Each box needs a different action. Protect the high-volume, high-margin items and never let them run out. Check the cost or price of high-volume, low-margin items. Put low-volume, high-margin items where customers see them, and stop reordering the rest.
Report four: margin by category
Sales growth can hide a falling margin for months. A category that sells more each month while earning less per sale is a problem the sales total will never show.
Read margin by category monthly, against the same month last year where seasonality matters. A drop of two or three points in one category is usually a supplier price rise nobody passed on. Sometimes it is a discount habit at the counter, and the discount report will say which.
Report five: stock that did not sell
The non-moving stock report lists items that have not sold for a set period. Every line on it is cash sitting on a shelf.
Read it monthly and act on it. Return what the supplier will take back, mark down what will sell at a lower price, and stop reordering the rest. Your stock reports can generate it for any period you choose.
Reports for a shop with staff
Once other people bill at the counter, two more views earn their place. Sales by staff member shows who sells and who only processes. Discounts and voids by staff member shows where exceptions concentrate.
Neither is about catching anyone. A person with many voids may simply need training on the billing screen. A person who never sells add-ons may never have been told what goes with what.
When POS sales reports lie
Reports are only as honest as the data behind them. A few common habits quietly distort every number.
| Habit | What it distorts | Fix |
|---|---|---|
| Open items billed by typing a price | Item and category reports | Create the item, even if late |
| Wrong tender pressed in a rush | Day close and payment mix | Correct before the day is locked |
| Cost not updated after a price rise | Margin reports | Update cost at goods receipt |
| Returns billed as negative sales | Item sales and margin | Use proper sales returns |
| Advances booked as sales | Daily and monthly totals | Record advances against orders |
The first habit is the most damaging. Every sale billed as a miscellaneous item is invisible to the item report. A shop with many of them has an item report that describes only part of its business.
A rhythm that works
- Every day: the day close, five minutes
- Every week: sales by hour and the item list, fifteen minutes
- Every month: margin by category and non-moving stock, half an hour
- Every quarter: compare the same months year on year
- Every time: act on one finding before reading the next report
The last line matters most. POS sales reports are worth reading only when something changes because of them. One action a week beats a stack of printed reports, and the back office keeps the history for when you want to check whether it worked.
Frequently asked questions
Which POS sales reports should a shop owner read?
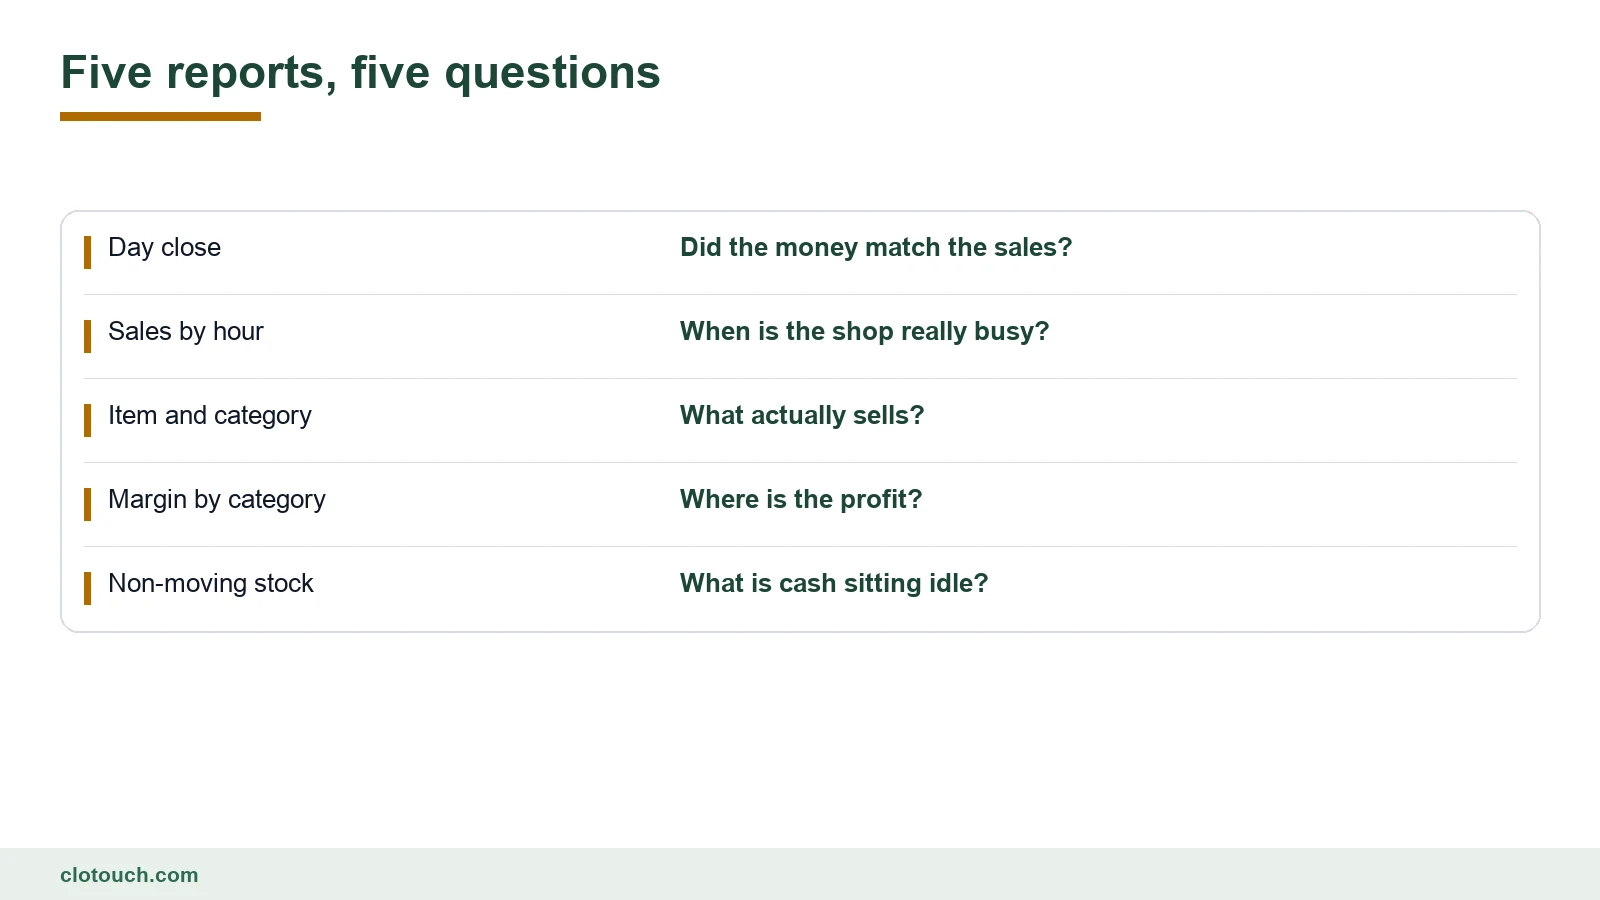
Five cover most decisions: the day close, sales by hour, item and category sales, margin by category, and non-moving stock. Together they answer whether the money matched, when the shop is busy, what sells, where the profit is, and what cash is idle.
How often should each report be read?
The day close daily. Sales by hour and item sales weekly. Margin by category and non-moving stock monthly. A quarterly year-on-year comparison catches seasonal patterns the monthly view misses.
Why read volume and margin together?
Because each alone misleads. A best seller can earn almost nothing, and a slow item can carry the best margin. Sorting items into four boxes by volume and margin shows which to protect, reprice, promote or drop.
What makes POS reports inaccurate?
Billing open items by typing a price, pressing the wrong tender, not updating cost after a price rise, billing returns as negative sales, and booking advances as sales. Each distorts a different report, and miscellaneous items do the most damage.
How do I turn reports into action?
Read on a fixed rhythm and act on one finding before reading the next report. Return, mark down or stop reordering non-moving stock. Pass on supplier price rises when a category margin drops. Then check the history later to see whether it worked.
Sources, method and author
Selected for a single-owner shop rather than a chain with an analyst. The five reports map to the questions that most often decide profit: cash accuracy, staffing, item mix, category margin and idle stock. The volume and margin grid is a standard portfolio view applied to retail items. The distortion table lists the habits that most often make reports unreliable.
- Investopedia on gross profit margin — what the margin report measures
- Investopedia on ABC inventory classification — ranking items by value
- Investopedia on internal controls — why the day close checks every other report
Clotouch is a point of sale product built by Clonet Technologies Pvt Ltd. The reports described exist in most billing systems, including ours. It is not accounting advice.
Author. Aman Raj. Published 3 November 2026 for Clonet Technologies Pvt Ltd, Bengaluru.