Menu engineering: using your own POS data to find the dishes that pay
Most restaurant menus are designed by a chef and priced by an owner. Very few are reviewed against what actually sold. Menu engineering is that review, and every Indian restaurant already has the data for it sitting in its POS system.
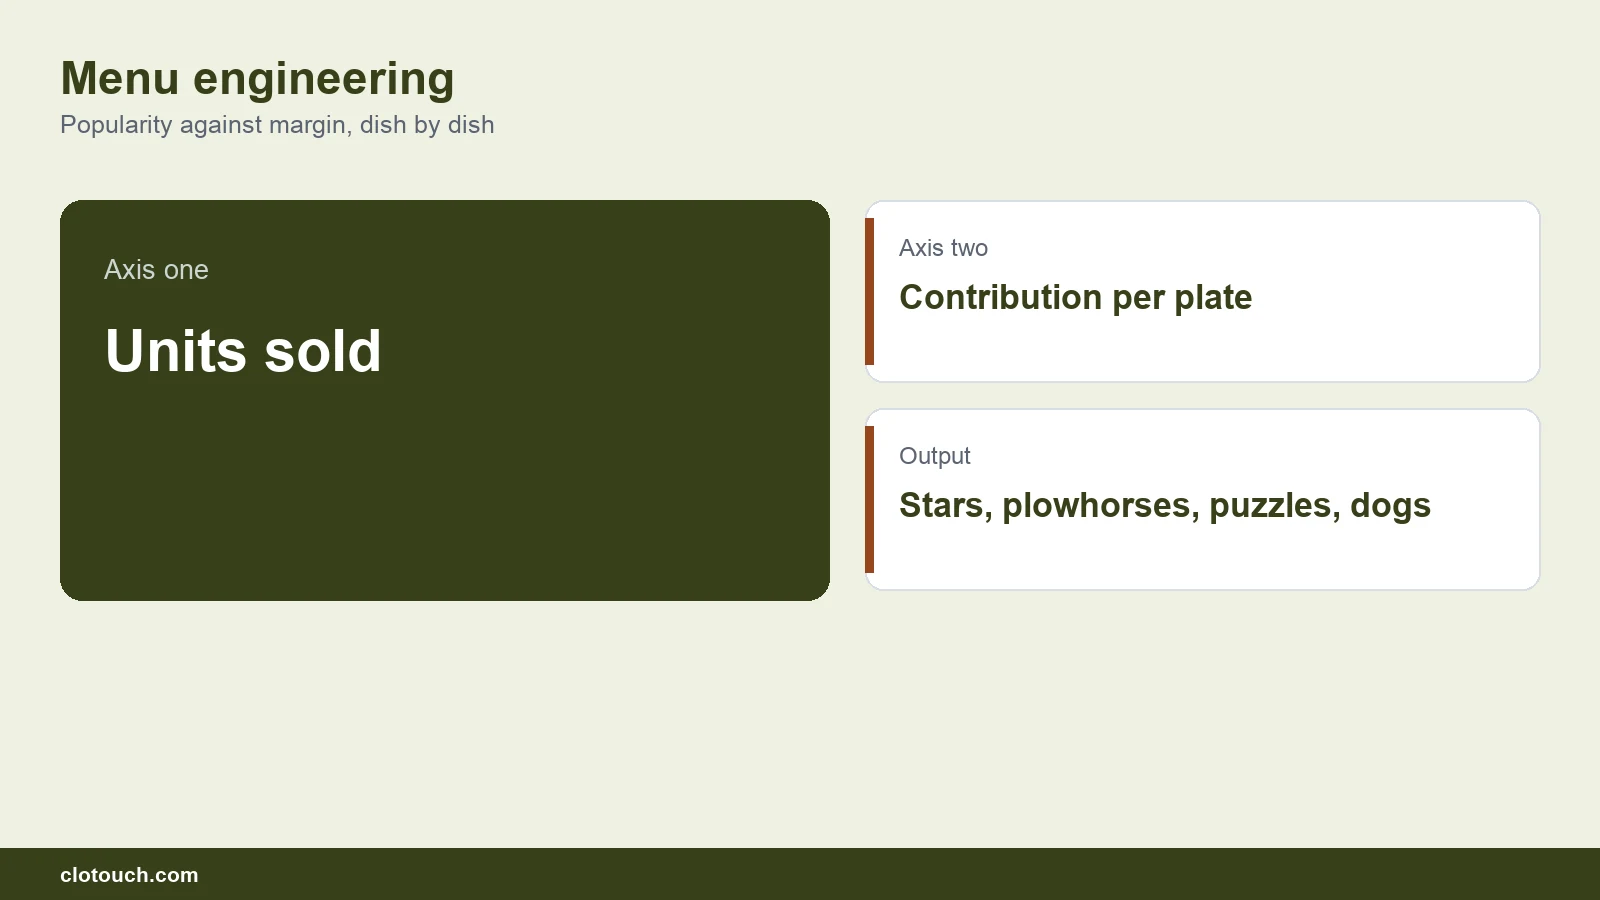
The method is old and unglamorous. It sorts dishes on two axes, popularity and contribution margin, and gives you four groups with four different answers.
On this page
The two numbers you need
The first is units sold, per dish, over a full period. A month is the usual choice. Anything shorter picks up the noise of one bad week.
The second is contribution margin. That is the selling price minus the cost of the ingredients on the plate. It is not gross profit percentage, and the distinction matters more than anything else here.
A dish at 80% margin selling three plates a day contributes less money than a dish at 55% selling forty. Percentages flatter small dishes. Rupees per plate, multiplied by plates sold, is what pays the rent.
The four groups
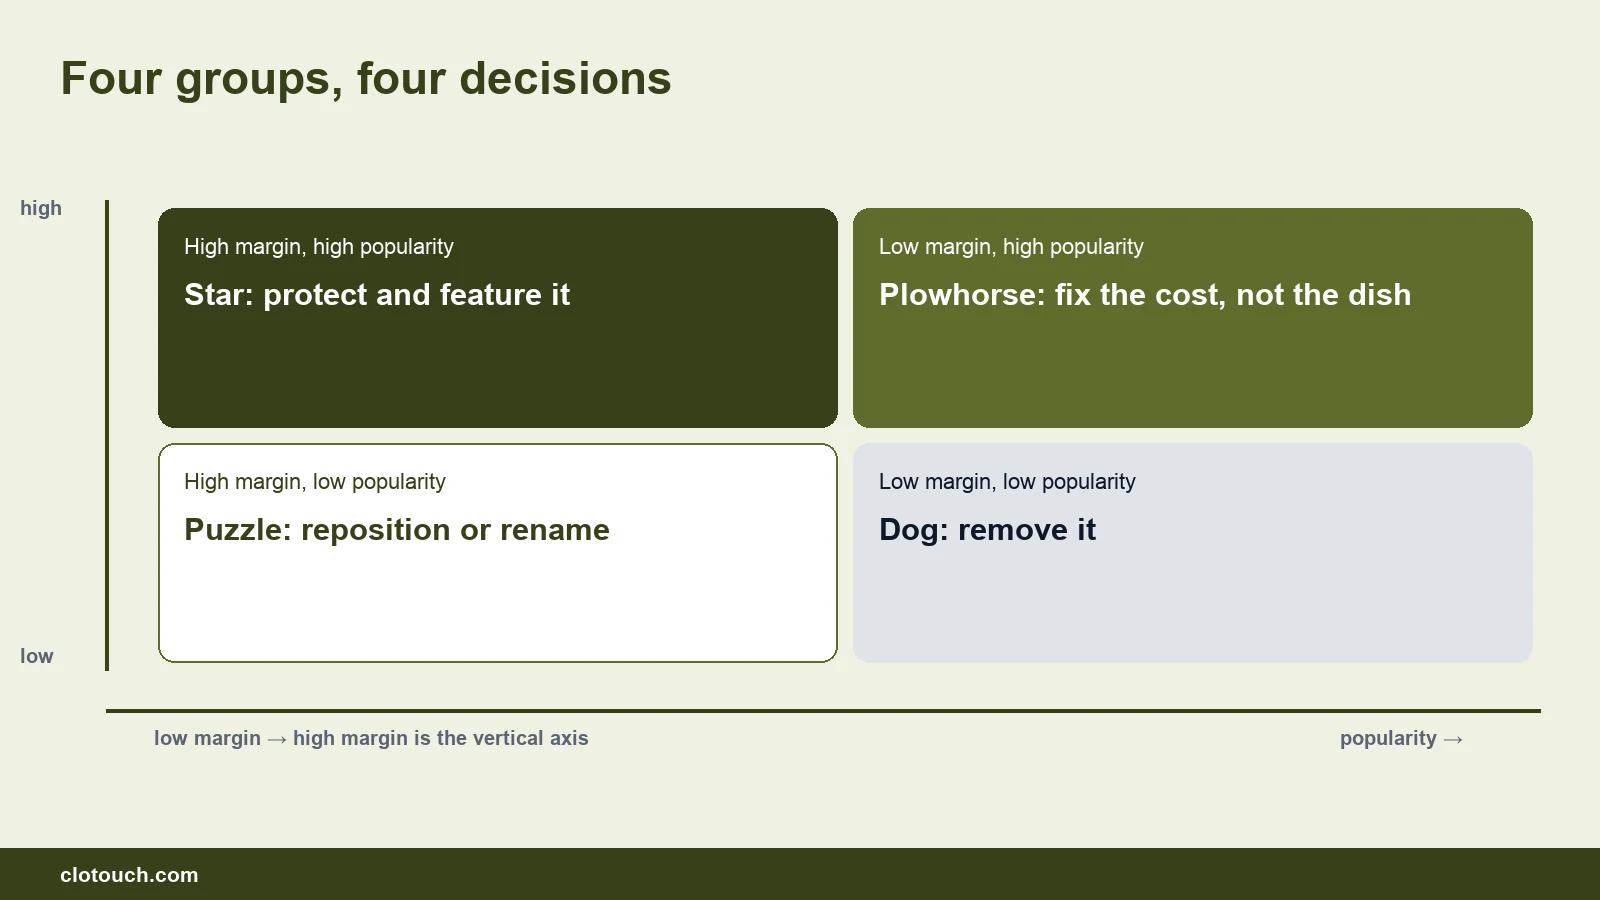
Stars sell well and make money. The only mistake available here is complacency. Keep the recipe fixed, keep the portion fixed, and put them where eyes land on the menu.
Plowhorses sell well and make little. This is the biggest group in most Indian restaurants, and the temptation is to raise the price. Usually the better move is to attack the plate cost. A plowhorse is popular, which means small cost changes multiply across many covers.
Puzzles make money but nobody orders them. Before deleting one, ask whether it is hidden. Position on the menu, the name, and whether staff mention it all move these. A puzzle that moves becomes a star.
Dogs sell badly and earn badly. Remove them. The argument for keeping one is usually that a regular customer likes it. Count how many plates that regular actually buys before letting it hold a menu slot and a fridge shelf.
Getting the plate cost right
Menu engineering fails when the plate cost is a guess. The work is in the recipe card, and it is one-time work that stays useful.
A recipe card lists each ingredient and the quantity used per portion, at current purchase prices. Costs drift, so prices need a refresh when your main inputs move. Oil, onions and tomatoes in India can change the picture on their own.
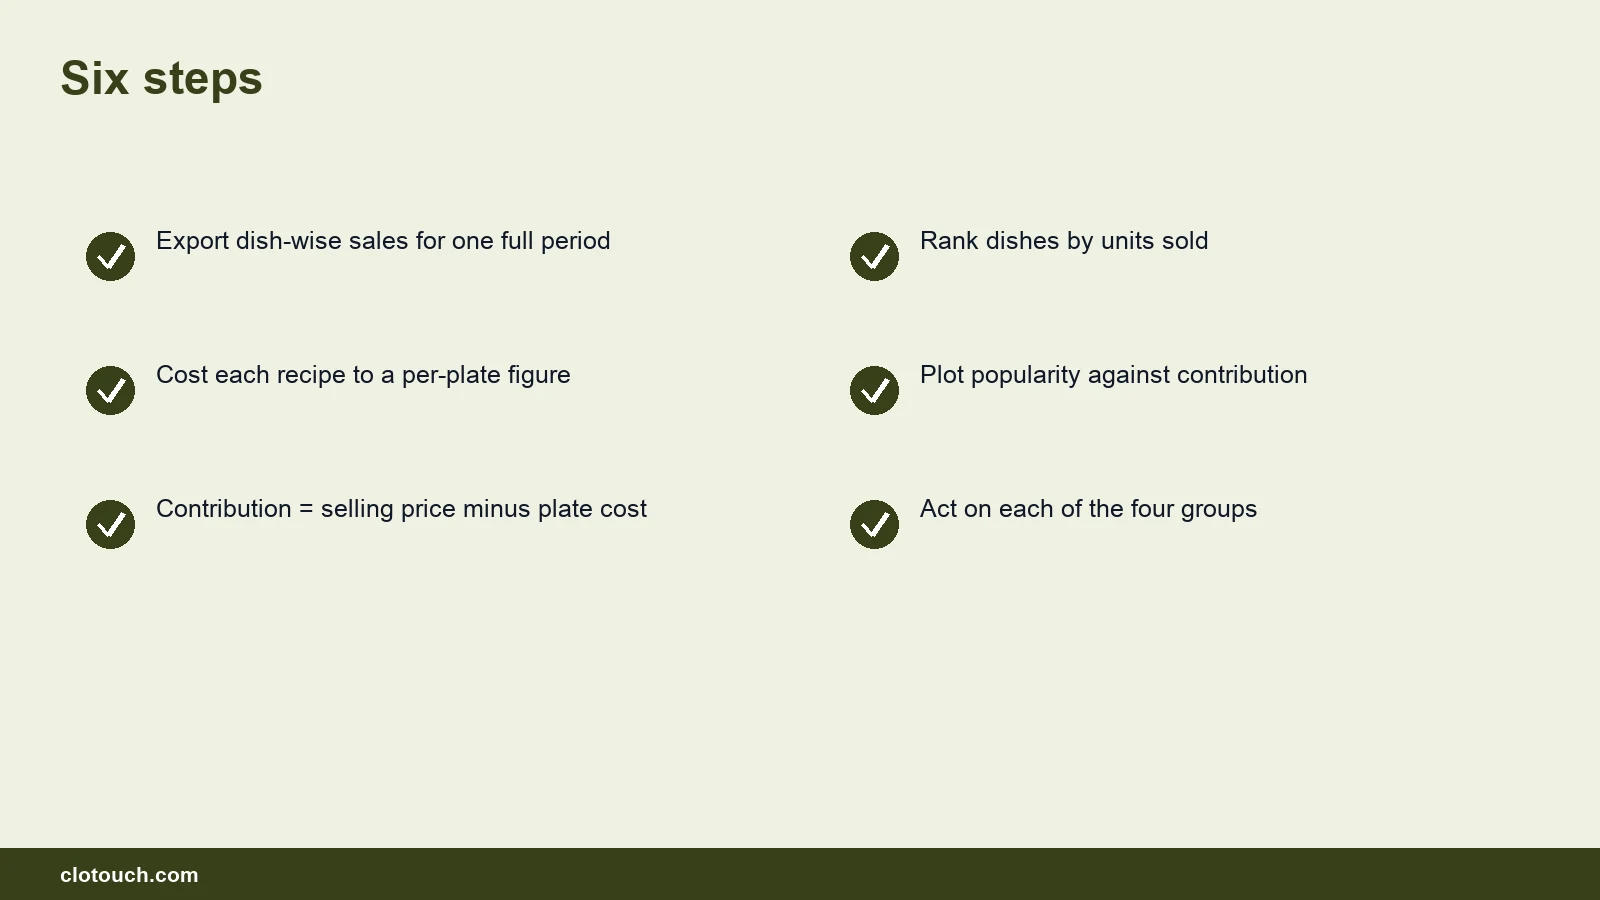
Where a POS holds recipes against dishes, this becomes automatic rather than a spreadsheet exercise. Each sale then depletes ingredients, which links menu analysis to real stock movement instead of theory.
| What you are told | What to check | Why |
|---|---|---|
| This dish has 70% margin | Rupees per plate | Percentage hides low volume |
| That dish is our bestseller | Contribution, not covers | Popular can still be unprofitable |
| We cannot remove it | Plates sold last month | Sentiment is not demand |
| Costs went up, raise prices | Plate cost by ingredient | One input may be the cause |
| The combo sells well | Margin on the combo | Combos often hide a loss |
Menu design follows the analysis
Once the four groups are known, the menu card itself becomes a tool. Stars and rescued puzzles belong where the eye lands first. On a single page that is the upper right area and the top of each section.
Two small habits help. Avoid a column of prices running down the right edge, because it invites comparison shopping. And describe high-contribution dishes properly, since a dish with a real description outsells the same dish listed as two words.
None of this works without the analysis behind it. Menu engineering decides what to promote; menu design only decides how.
Combos, offers and the margin they hide
Combos are the most common place where a restaurant loses money while believing it is gaining volume. A thali or a meal deal bundles several plate costs against one price.
Cost the combo as its own item with its own recipe. If the system prices a combo by discounting the sum of its parts, the reported margin will be wrong every time it sells.
The same applies to delivery. Aggregator commission is a real cost against the same plate, so a dish that is a star in the dining room can be a dog on delivery. Where orders arrive through several channels, keep the channel on the sale so the two can be separated. Self-ordering flows such as Scan2Order should tag the channel in the same way.
Where the data goes wrong
Three things commonly corrupt the analysis, and all three are fixable at the counter.
Modifiers recorded as free text make identical dishes look like different ones. Dishes billed under a generic item, such as a catch-all for specials, disappear from the ranking. And cancelled or comped items counted as sales inflate popularity for food nobody paid for.
Each of these is a billing discipline question before it is an analysis question. A kitchen ticket trail that records amendments is what lets you separate the food that was sold from the food that merely left the kitchen.
How often to run it
Quarterly is enough for most restaurants. Monthly is worth it while you are actively changing the menu, and after any significant move in ingredient prices.
One caution about timing. Do not judge a dish on a festival month or a single event. Seasonal demand distorts both axes, and a puzzle in July can be a star in October.
Related reading
Frequently asked questions
What is menu engineering?
A review that sorts every dish on two axes, how many units sold and how much contribution margin each plate earns. The four resulting groups are usually called stars, plowhorses, puzzles and dogs, and each calls for a different action.
Is contribution margin the same as gross profit percentage?
No, and the difference is the point. Contribution margin is rupees per plate, which is selling price minus ingredient cost. A high percentage on a dish nobody orders contributes less money than a moderate percentage on a dish that sells constantly.
What should I do with a popular dish that earns little?
Attack the plate cost before the menu price. A plowhorse sells in volume, so a small reduction in ingredient cost multiplies across many covers. Raising the price on a popular dish risks the volume that made it valuable.
Can I run menu engineering from POS data alone?
Sales volume comes from the POS directly. Contribution margin also needs a recipe cost per dish. Where the POS holds recipes against menu items, both numbers come from one system and the analysis stops being a spreadsheet job.
How often should a restaurant do this?
Quarterly suits most restaurants, and monthly while the menu is actively changing. Avoid judging dishes on a festival month, because seasonal demand distorts both popularity and cost.
Sources, method and author
Method. The four-group framework used here is the standard menu engineering matrix in hospitality management, which classifies dishes by popularity and contribution margin. Operational points reflect restaurant POS deployments run by Clonet Technologies in India. No profitability figures are quoted, because they are specific to each kitchen.
- National Restaurant Association of India — industry body for Indian food services
- Institute of Hotel Management — hospitality education in food and beverage cost control
- FSSAI — food safety obligations that constrain recipe and storage changes
- Goods and Services Tax portal — tax treatment of restaurant supplies
Disclosure. Clonet Technologies Pvt Ltd builds and sells Clotouch POS, which produces the dish-wise reports described here. Linked product pages are our own.
Author. Aman Raj. Published 6 September 2026 for Clonet Technologies Pvt Ltd, Bengaluru.